Overview
Quickstarts
Additional Info
Getting Debugging Information
Follow these steps to report detailed debugging information.
Chrome
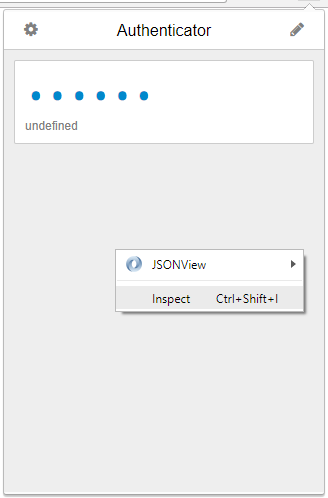
- Open Authenticator
- Right click Authenticator and click “Inspect”
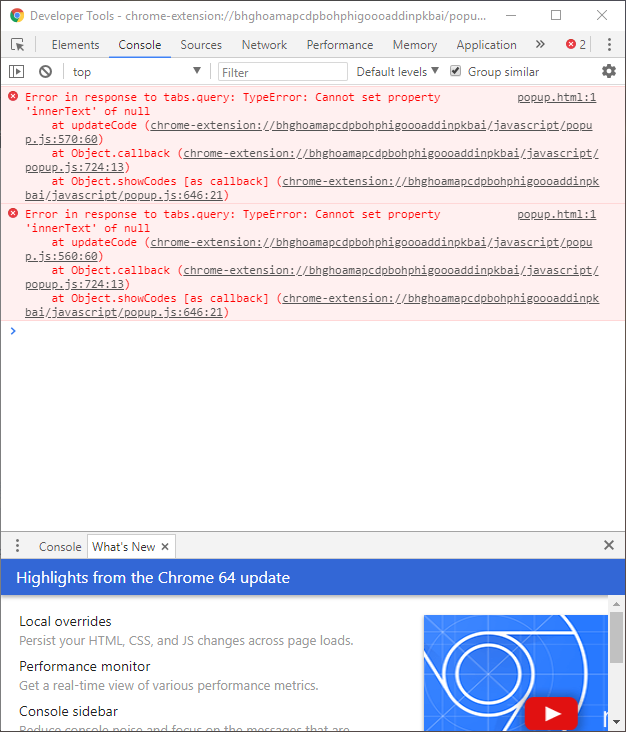
- Go to the “Console” tab
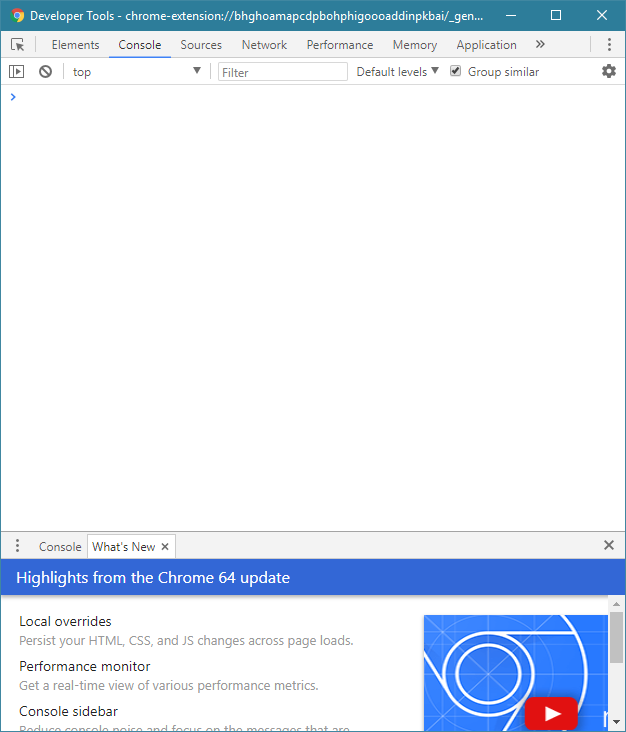
- Copy and paste any messages into the issue description
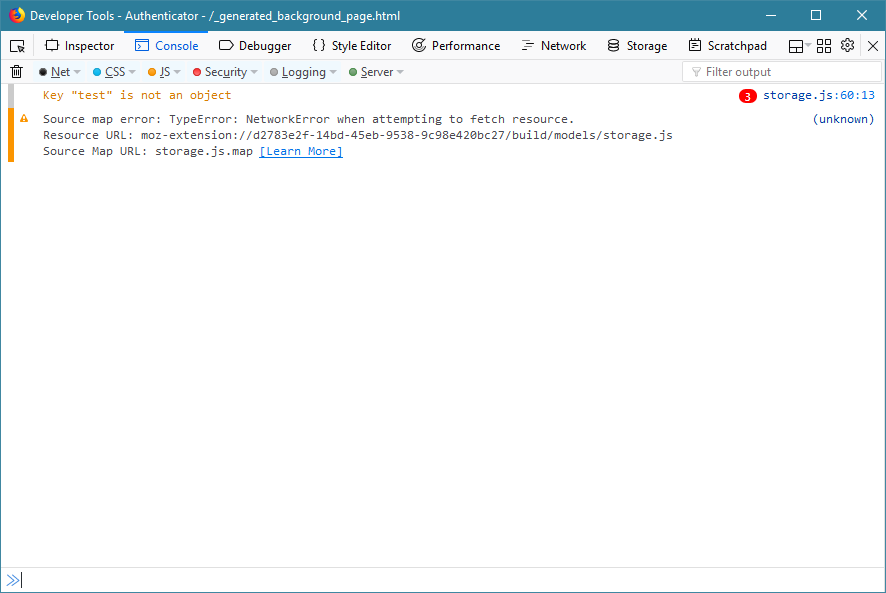
Firefox
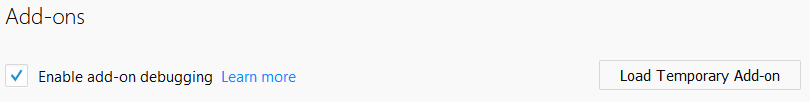
- Go to
about:debugging - Check the box that says “Enable add-on debugging”
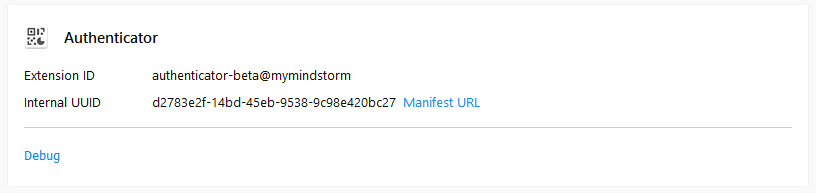
- Click the link that says “Debug” under Authenticator
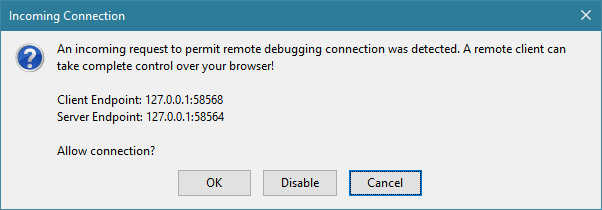
- Click “Ok”
- Make sure that you are on the console tab
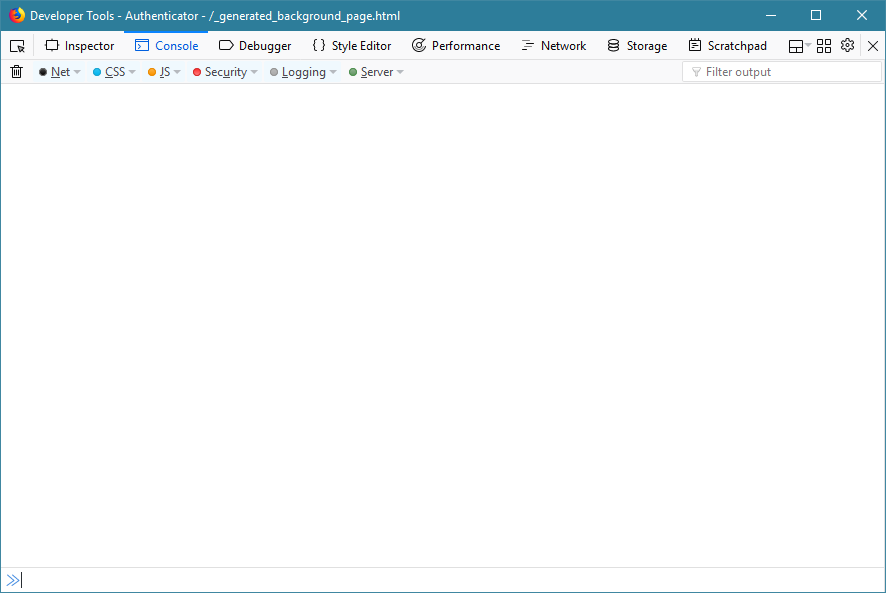
- Open Authenticator again
- Copy and paste any messages into the issue description